| |
|||
Content |
|||
 Newsletter
issues Newsletter
issues |
|||
| Combined
index |
|||
| Imprint |
|||
| Contact
|
|||
The European Population: A Historical Data Handbook for 21 European Countries from 1850-1945
Franz RothenbacherThis contribution describes the project which is to publish a historical data handbook on the European population in 21 European countries, covering the time period of the first demographic transition, the years 1850-1945. All eighteen Western European nations are included plus the three Eastern European countries Czechoslovakia, Hungary and Poland. The handbook covers such topics as population development; the population structure by sex, age and marital status; the regional population structure; annual vital statistics developments in the fields of population growth and migration, fertility and legitimacy, infant mortality and life expectancy, nuptiality and divortiality. Furthermore, household and family data have been collected systematically using the population censuses as a basis. The book comprises several introductory comparative chapters and 21 national chapters for each country. Extensive documentation of available data and sources concludes the volume.
Background
The origins of this handbook go back to the research project 'Family
Change and Family Policies in the West', started in 1994 at the Mannheim
Centre for European Social Research (MZES) in Mannheim, Germany. The project
had an international perspective, covering the main Western and three
Eastern European countries: Austria, Belgium, Czechoslovakia, Denmark,
Finland, France, Germany, Greece, Hungary, Italy, The Netherlands, Norway,
Poland, Portugal, Spain, Sweden, Switzerland, and the United Kingdom.
The project also included some non-European countries: Canada, New Zealand,
and the United States of America. From the beginning, Iceland, Ireland,
and Luxembourg were not included, nor were the Eastern and southeastern
European countries. The project produced standardized case studies for
all project countries and two additional comparative volumes: one volume
on family change, and one on family policies. While the project focused
mainly on family policy and used demographic, household, family, and employment
structures as a baseline and framework for the national family policy
profiles, it soon became clear that in the realm of demography and household
and family statistics the available data could not fulfil the project
requirements. The project had a very long time horizon, reaching back
- at least metaphorically - to the nineteenth century. The available data
did not suffice for such an ambitious endeavour: they were mostly national
data, but without long time series; and the international-especially European-data
only went back to the 1960s. Therefore we decided to set up our own demographic
database.
The work originated with a dataset compiled by the HIWED project. This
dataset extended up to 1975 and included thirteen industrialized Western
European countries: Austria, Belgium, Denmark, Finland, France, Germany,
Ireland, Italy, The Netherlands, Norway, Sweden, Switzerland, and the
United Kingdom. First, this dataset was checked for errors (which were
numerous) and corrected. Second, it was updated from 1970-75. Demographic
data available for the time periods between censuses become more and more
inaccurate the longer the period of time between censuses is. Therefore
the annual vital statistics data were corrected after the censuses of
1980/1, and these corrected data were used for the period after 1970.
The annual time series were updated up to the early 1990s. (The same problem
occurs with the vital statistics data from the 1990s, which will not be
corrected before the censuses of 2000/1). Third, not only were data checked
and extrapolated; in addition, new countries were added. Completely new
time series were collected for Czechoslovakia, Greece, Hungary, Iceland,
Luxembourg, Poland, Portugal, and Spain. Moreover, several new indicators
were formulated and calculated: the illegitimacy rate, the crude legal
separation rate, and the separation rate, among others. A completely new
dataset was compiled for the population structure, containing for each
census a table combining age in oneyear age groups with sex and the marital
status. Finally, we also collected completely new data on household and
family statistics. This field of historical European statistics had been
completely untouched thus far: there were national collections as standalone
products (for Germany see Rothenbacher, 1997), but household and family
statistics were usually only rudimentary additions to general historical-statistical
works. For the first time, the main available data wereeen compiled at
the national level for the 21 countries included in this data handbook.
Given the very time-consuming task of compiling annual statistics for
21 countries covering over 100 years (the number of censuses used for
data collection amounts to approximately 200), regionalizing this huge
amount of variables, time series, and combinatory tables would have been
impossible for only one or a few persons. This is a lesson learned from
the Princeton Fertility Project, which took more than a decade to complete
and a large staff of people to collect, process, and analyse data at the
regional level for the subject of fertility alone.
The data are thus far complete to such a degree that not only individual
countries can be compared, but countries can also be grouped into clusters
and compared with other individual countries or country clusters. The
dataset allows, for example, a comparison of the Nordic crude birth rate
with the Mediterranean crude birth rate. Furthermore, European rates can
be and have been calculated. Europe can be delimited in various ways:
it is possible to create rates for Western Europe, for Central Europe,
or for Continental Europe alone. Calculating European rates allows for
very instructive comparisons of national rates with the European (weighted)
averages. In principle, variation coefficients can be calculated and therefore
convergence and divergence analysed.
Contents
The 21 country chapters have a standard format. Each chapter consists of eleven text sections and an appendix with tables and figures. The eleven sections are (1) State Formation and Territory; (2) Regional Population Structure; (3) Population Growth; (4) The First Demographic Transition; (5) Fertility and Legitimacy; (6) Mortality and Life Expectancy; (7) Marriage and Divorce; (8) Age, Sex, and Civil Status; (9) Family and Household Structures; (10) The National System of Demographic Statistics; and (11) Boundary Changes. Section 10 is furthermore divided into three subsections, presenting information on the development of official statistics in the fields of a) population structure, b) vital statistics, and c) households and families. Each chapter concludes with a standardized appendix containing tables and figures.
Structure of Country Chapters
We will now outline the different sections of the country chapters. A
short introductory section on state formation and territory (1) presents
essential background information necessary for understanding, using, and
interpreting the statistical information presented thereafter. This section
describes the political history of each country in terms of state evolution,
date of independence, major changes in political regimes, and essential
boundary changes through secession, mergers, or territorial losses. Not
only politics, but also the longterm economic development, the economic
position of the country in European comparison (the 'wealth of the nation'),
and important features of the economic structure are described. In addition,
major features of the social structure are highlighted which may have
important and explanatory influences on population and demographic developments.
The section on regional population structure (2) deals with the internal
population distribution of a country. Two indicators are used to describe
the regional population structure: the proportion of each region's population
in per cent of total population, and the population density (in inhabitants
per square kilometre) of each region. The hundred years from 1850 to 1950
reveal major shifts in population distribution which are known as urbanization
and rural exodus. These data show the main settlement structures of a
country and the extent to which this structure changed during modernization.
The section on population growth (3) deals with the longterm growth processes
during the first demographic transition. The main result of the demographic
transition in all European countries was enormous growth in the European
population and the population of the individual nationstates. Nevertheless,
this development was very different according to the conditions in each
country. Not only the longterm growth processes and macrosettings are
discussed, but also the impact of wars, economic crises, and epidemics
on growth rates. This section also describes major developments in net
migration.
The next section describes the first demographic transition (4) of each
country. The 'theory' of the demographic transition is in principle a
model describing the development of societies from a state of high population
turnover to a state of low population turnover. The model furthermore
states that the death rate declined first and the birth rate reacted later
also with a decline. The development of individual countries shows that
this was not always true, and that in several countries the birth rate
declined before the death rate. Nevertheless, the model is an important
heuristic device for understanding this longterm process. The section
describes the main features of the national process of demographic transition,
each country's pretransition level, start and speed of transition. Explanations
or interpretations of the individual characteristics of the demographic
transition are given wherever possible.
The section on fertility and legitimacy (5) presents the data on legitimate
and illegitimate fertility and on the proportion of illegitimate births
to all births (the illegitimacy rate). The disaggregation of births by
legitimacy and the calculation of agestandardized birth ratios by legitimacy
reveals interesting and important aspects of family organization (the
importance of cohabitation), illegitimacy, and attitudes towards the legal
status of children. The causes of illegitimate fertility have been manifold
and differ from country to country.
The section on mortality and life expectancy (6) presents and discusses
the data on the infant mortality rate. This section is closely related
to the section on the first demographic transition, because the infant
mortality rate strongly influenced the crude mortality rate. Therefore,
in a country where the infant mortality rate was high, the crude mortality
rate was high as well. The national figures are described with reference
to other European countries. The singularities of the national developments
are presented and possible explanations are given. A second aspect of
mortality is life expectancy which provides a much broader picture of
mortality. Men and women are included and mortality is calculated also
for higher age groups.
The section on marriage and divorce (7) deals with the marriage patterns
in a country. Indicators used to describe nuptiality and marriage behaviour
are the mean age at marriage, the proportion married at age 20-24, the
marriage ratio, and the celibacy rate. The typical configuration of a
country concerning these indicators is presented and the country's position
with reference to such typologies as the 'European Marriage Pattern' is
discussed. This section also deals with the long-term growth of marital
instability due to divorce and legal separation.
The section on age, sex, and civil status (8) discusses the development
of the population in a more disaggregated form, looking at the development
of the age structure and population changes in the marital status, all
according to sex. Major developments are population ageing, which in most
countries was already visible in 1900, the increase of the proportion
married until the mid-1930s, the lowering of the age at marriage, and
the decline in celibacy.
In the section on family and household structures (9) the presentation
is solely based on the available official household and family statistics
collected by the statistical offices. Historical studies using primary
sources such as original population census sheets or early population
registers are not reviewed here; nevertheless, important relevant results
have been included for explanatory purposes.
The section on the national system of demographic statistics (10) is documentary
in character. It describes the available statistics concerning the introduction
of investigation, the history of data collection, and the definition of
statistical concepts for the three fields of population structure, vital
statistics, and households and families. Especially important is the documentation
of the definitions of statistical concepts, because only knowledge about
the way data are collected and processed allows for a meaningful interpretation
of the empirical facts. The documentation of the definition of statistical
concepts is more important for household and family statistics, which
were not standardized until after 1945.
The final section on boundary changes (11) provides information on the
most important boundary changes necessary for understanding and interpreting
the different population sizes and the demographic time series.
After the textual presentation there is a large section with appendix
tables and figures, comprising six standard tables with statistical data,
one documentary table, and several figures. All tables and figures included
in this appendix have been standardized as far as possible. Appendix Table
1 documents the census dates and presents for each population census the
most basic statistical information: the population by sex, civil status,
and three age groups (0-14, 15-64, and 64+) in absolute and relative terms.
Appendix Table 2 includes the regional population distribution for the
different population censuses in relative terms. The proportion of each
region in per cent of the total population has been calculated. Appendix
Table 3 presents a different kind of regional data: it gives the population
density measured by the number of inhabitants per square kilometre for
each region and population census. Appendix Table 4 comprises demographic
time series, if available, for the period 1850-1945. The time series are
structured in the same way for all countries. They contain information
on midyear population, two different population growth rates, migration,
several fertility indicators, legitimacy, and various mortality, nuptiality,
and divorce measures. Appendix Table 5 presents the development of life
expectancy at various ages for both sexes. The Appendix Tables 6A-6E on
households and families are less highly standardized due to the varying
national statistics. But, wherever possible, the tables provide information
on the main household types such as oneperson, family, and institutional
households (absolute and per cent) together with the respective population
living in these households (Appendix Table 6A). A second table presents
the distribution of households by size in absolute terms (Appendix Table
6B) and a third table in per cent distribution (Appendix Table 6C). A
fourth table gives average household sizes for different household types
(Appendix Table 6D). A fifth table-if available-presents information on
household composition (Appendix Table 6E). These five tables are included-if
possible-as standard and are supplemented by additional tables if other
interesting statistics are available. Such additional data may include
disaggregation of households by socioeconomic status of the household
head or regional information. Appendix Table 7 documents the availability
of the individual vital statistics and population census variables. Appendix
8 includes several standardized figures on population by age, sex, and
marital status. These figures are based on the population censuses. The
number of figures varies between countries according to the availability
of population census results.
All sources and references have been combined in one bibliography at the
end of the volume. This bibliography has two main sections: sources and
references. Sources are all statistical titles that have actually been
used for this data handbook, while references are all the literature cited
in the texts. The references have been arranged in alphabetical order.
The sources have been subdivided, first into sources used in the comparative
Introduction, and then into sources used for each of the 21 countries.
For each country the sources have been further divided into three sections:
(1) sources on vital statistics, (2) sources on population structure by
age, sex, and marital status, and (3) sources on population census results
on households and families.
Data Presented
This data handbook presents the population, demographic, and household data, collected in a standardized and systematic way for the 21 countries of Western and Central Europe whenever possible from 1850 to 1945. Several general guidelines have shaped the work from the beginning:
- Territorially aggregated data: results have been collected at the
level of the nationstates only, and regional data have only been collected
for population size and population density.
- Complete census coverage: all the population censuses in the time
period have been covered, amounting to nearly 200 individual censuses
in the 21 countries.
- Disaggregated data collection: while there was no regional disaggregation,
in other respects the data have been collected with as much detail as
possible on a disaggregated level. Thus, vital statistics have been
collected on an annual basis and have not been aggregated into time
periods (quinquennia or decennia). Furthermore, the data on age, sex,
and marital status have been collected in the most disaggregated way
possible. Whenever available, oneyear age groups have been chosen, and
all the different types and combinations of the marital status are included
(there are more detailed types of marital status in some countries than
the usual four types, single, married, widowed, and divorced).
- Historical perspective: for all countries the collection starts in the nineteenth century, for some already in the eighteenth. The series are documented from 1850 in this data handbook. Nevertheless, in some cases the data collection reaches much further back into history.
Selected Comparative and National Results
Population Structure and Density
Population density continues to differ greatly by geographic and geoeconomic
position of the European countries. Already since the Middle Ages the
corridor from southern England via The Netherlands and Belgium down the
Rhine Valley through Switzerland to Northern Italy was the most economically
developed and most densely populated region of Europe. This remained the
case in the nineteenth century and was even enhanced by the population
revolution; external and internal migration processes added to it. Therefore,
there is a supranational system of population distribution in Europe.
Thus, the centre of population gravity in Europe since the sixteenth century
has shifted to continental Europe north of the Alps.
It can even be said that since the decline of the Roman Empire, in a very
longterm perspective, the centre of gravity of the European population
shifted from the Mediterranean to north of the Alps. But this was only
a gradual movement, and until the high Middle Ages, Italy for example
was one of the most densely populated countries. Furthermore, the largest
cities, such as Constantinople, Venice, and Genoa, were located on the
Mediterranean. From the high Middle Ages to the sixteenth century there
was a further shift from the Mediterranean to northern Europe, caused
by the rise of the Ottomans and the loss of North Africa, parts of Spain
and Portugal, and finally of most of the Balkans to the Muslims. As a
result, the Mediterranean region was split between cultures; the trading
routes were threatened by the resulting instability and increasingly shifted
away from the Mediterranean region to overseas, resulting in the decline
of Mediterranean trade and of such trading powers as Venice and Genoa.
The major discoveries of new territory in the fifteenth and sixteenth
centuries by the Portuguese, Spanish, Dutch, and British finally moved
the economic and population centre to continental Europe.
Starting in the sixteenth century the Southern European powers Portugal
and Spain suffered from an economic decline which became very apparent
in the seventeenth century, when the powers of the North, mainly the Dutch
and the British, became dominant. The South declined not only in terms
of economic and military power, but also in terms of population (Pounds,
1979; Catalan, 1995), as can be seen from the number of inhabitants of
the European countries. Germany, although not a seapower, had the largest
population in 1870 with 41 million. France came second with 35 million;
population growth in France had already been low since the late eighteenth
century and continued during the nineteenth. The United Kingdom came third
with 28 million inhabitants. Population growth in the British Isles and
Ireland was quite vigorous, and the population of the United Kingdom exceeded
that of France in the decade 1900-10; by 1930 the UK had six million more
inhabitants than France. Italy ranked fourth in population with 27 million
in 1870. Population growth was higher than in France, but far lower than
in the United Kingdom. In 1930 Italy's population was equal to that of
France. While France's population increased by only six million inhabitants,
Italy's population went up by 14 million. Spain's population ranked fifth
in 1880 with 17 million inhabitants, but population growth was quite strong
until the 1930s, with an increase of approximately seven million people.
Most other European countries were small or medium-sized in terms of absolute
population, though some showed strong growth. Population growth was highest
in The Netherlands: 'only' 3.6 million in 1870, the population doubled
in the decade 1920-30. Further strong increases occurred in the Nordic
countries, especially in Denmark, Finland, and Iceland.
There is no relationship between the size of a country in terms of territory
and the size of its population: a large territory does not automatically
lead to a large population and vice versa. When the different territorial
sizes of the European countries (in square kilometres) are compared, France
is the largest, followed in rank order by Germany, Spain, Sweden, Poland,
Finland, Italy, Norway, and the United Kingdom. This list shows that the
countries with the highest population growth are often those with small
territories and that there is only little correlation between population
size and size of the territory.
Population density of the European countries is given in Table 1. Population
density is defined as inhabitants per square kilometre. In 1870 the most
densely populated European country was Belgium with 164 inhabitants per
sq. km. The United Kingdom was second, followed by The Netherlands, Italy,
France, and Germany. This picture changed only gradually up to 1930: Belgium
remained the most densely populated country with 265 inhabitants per sq.
km., while The Netherlands moved into second place due to their strong
population growth. The United Kingdom fell to third place, followed in
order by Germany, Italy, and Luxemburg.
Table 1: Population Density in Europe (inhabitants
per sq. km.)
Population Growth
Population growth is made up of three variables: the number of births,
the number of deaths, and the extent of migration, i.e. of net migration.
There are very different possibilities of combination (leaving migration
aside for the moment): high fertility can go along with high mortality,
resulting in medium natural population growth. High fertility can also
occur with low mortality; in this case the natural population growth would
be highest. Low fertility can be combined with low mortality, in which
case natural population growth would also be medium. Finally, low fertility
can be combined with high mortality, in which case natural population
growth would be lowest.
To these four different combinations can be added the element of net migration
(the difference between immigration and emigration) which can be high
or low. Thus, a country with high natural population growth could have
high net migration, reducing the overall population growth substantially.
By contrast, a country with low natural population growth could have low
net migration, with a similar effect for overall population growth.
It is not possible to determine a priori whether these three variables
are high or low in a given country, as it depends on many factors related
to the social, economic, and value (religious) structure of the population.
The birth rate in preindustrial agrarian countries, for example, depends
very much on the type of agricultural organization and the system of inheritance.
The death rate depends heavily on the amount of infant mortality, which
again depends on factors related to the educational level of the population,
development of medicine, and sanitary infrastructure. Migration, finally,
also depends on a variety of factors, such as the legal possibility to
immigrate or emigrate, the population pressure due to overpopulation,
expulsion of parts of the population due to political or religious conflicts
(Huguenots, Puritans, Waldensians). Of all these, relative overpopulation
(or relative underpopulation in countries receiving immigrants) is probably
the most important factor causing migration.
Population growth could furthermore depend on the population density in
a country at the start of the demographic transition. It might be postulated
that the higher the population density in a country at the pretransition
stage, the lower the population growth during the first demographic transition.
The underlying supposition would be that high population density will
cause people to limit reproduction due to the difficulties arising from
high settlement density.
Figure 1: Population growth in Europe, 1850-1945
(1850, etc. = 100)
Figure 1 presents population growth rates from annual mid-year population
figures based on the year 1850 (or 1871, 1919, etc.). The five countries
with the highest population growth during the period 1850-1945 are Greece,
The Netherlands, Denmark, England and Wales, and Finland. But Greece has
to be removed from this list, because of its large territorial gains since
independence. The five countries with the lowest population growth (in
declining order) are Spain, Switzerland, Luxemburg, France, and Ireland.
Ireland is the only European country in which population declined absolutely
from 1850 to 1945, mainly caused by emigration. These patterns obviously
do not confirm the above hypothesis that population growth will be low
in countries that had a low population density already before the start
of the first demographic transition. As early as 1870 The Netherlands
and the United Kingdom had among the highest population densities in Europe.
Nevertheless, Denmark and Finland, which are in the topfive group with
the highest population growth, had a remarkably low population density
in 1870. Let us now look at the country group with the lowest population
growth: these countries by no means belong to the group with a high population
density in 1870. In France, Luxemburg, and Switzerland, population density
was on a medium level, while Spain's population density was low.
Mere number of people per square kilometre therefore does not explain
population developments. Rather, there must have been different 'population
regimes' (Bevölkerungsweisen, Gerhard Mackenroth) in European countries.
These different population regimes are probably strongly related to the
different European marriage patterns, to the unequal economic structure
in Europe, leading to early industrialization in one country and persistence
of agriculture in another, and to the type of agricultural organization
in the countries still strongly dominated by agriculture until the mid-twentieth
century.
The differing population growth of course had enormous consequences for
the territorial population pattern in Europe. Looking at the population
of individual European countries as a proportion of the overall European
population of that time, we see that the population of some countries
increased relative to the total European population, while that of others
decreased. Countries whose population shares increased are The Netherlands,
Denmark, Finland, Greece, and the United Kingdom. Countries with severe
relative losses are mainly France and Ireland, and to some degree Spain.
Mortality and Life Expectancy in Europe
The model of the first demographic transition states that the mortality decline is the decisive factor for the fertility decline, because people reduced their fertility according to their children's improved chances of survival (Schofield, Reher, and Bideau, 1991). No matter which declined first in the demographic transition, mortality or fertility, the longterm trend in mortality is similar to that of fertility. The general trend is a decline in mortality at least since the 1880s, with some national variation. There were pioneering countries, in which mortality declined some decades earlier, as well as laggards, in which mortality fell later than the average. Until the 1940s there was a clear convergence in the crude mortality rate: mortality in those countries with high mortality around 1890/1900 declined faster than in countries where mortality was already low at that time. Already in the 1840s the national differences in the mortality rate had become fairly small. Nevertheless, the structure between countries remained very stable, thus reflecting rather invariable characteristics of European societies, such as geographical characteristics, country size, and religion.
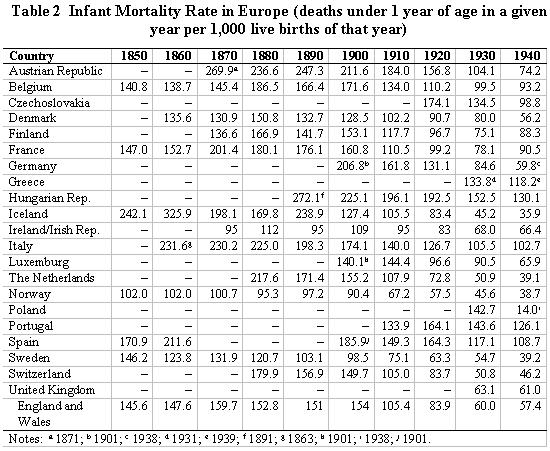
Table 2: Infant Mortality Rate in Europe
(deaths under 1 year of age in a given year per 1,000 live births of that
year)
This surprising progress in mortality reduction cannot be interpreted
in the sense that adult people lived much longer than before. Instead,
the mortality decline during the first demographic transition was mainly
a decline in infant mortality. The greatest progress was made in combating
deaths in early childhood, mainly during the first five years, primarily
due to the introduction of vaccinations (the first one was for smallpox
shortly after 1800), sanitation, and breastfeeding, among others (Table
2). The first stage in the so-called epidemiological transition was therefore
the fight against early childhood diseases. The secondmost dangerous phase
of human life was young adulthood, which was mainly threatened by tuberculosis.
Whereas much progress in reducing childhood infectious diseases was already
made during the nineteenth century, the fight against tuberculosis began
to be won only in the first half of the twentieth century. In the nineteenth
century, if people reached age 60 they had a good chance of living to
age 70 or more. Mortality reduction for the elderly was rather small until
the 1940s; the major decreases in mortality of the elderly were achieved
after 1945 and mainly since the 1970s.
Marriage Patterns in Europe
In 1965, John Hajnal distinguished between the 'European Marriage Pattern' and the 'Non-European Marriage Pattern' (Hajnal, 1965), with the dividing line between the two running from St. Petersburg to Trieste. This model claims to be valid for the time period until roughly 1940. The European marriage pattern is defined by a high age at first marriage, low nuptiality, and a large share of people remaining single for life. By contrast, the non-European marriage pattern is defined by a low age at first marriage, high nuptiality, and a small share of the population remaining single. According to this definition, the whole of Eastern and southeastern Europe belongs to the non-European marriage pattern. Hajnal's data refer to the time period until roughly 1900; in the subsequent time period, Hajnal concedes modernization processes on both sides: the non-European marriage pattern becoming more like the European marriage pattern and the European more like the non-European marriage pattern. The question here is whether this hypothetical convergence of marriage patterns for the time after 1900 can really be proved (see Rothenbacher, 1998).
From Universalization of Marriage to Deinstitutionalization
Until the end of the nineteenth century, in many countries access to
marriage was restricted to persons having a certain amount of assets.
This regulation did not originate in the ancien régime, but was
introduced in the first half of the nineteenth century to avoid the pauperization
of broad segments of the population. The towns in particular feared the
burdens of providing communal care for the aged and the sick caused by
the growing population exceeding the positions available in the labour
market. Marriage was often the precondition for access to political rights,
such as the communal right to vote, and thus was highly valued. Access
to marriage was restricted particularly in the southern German states
until 1867, whereas Prussia was more liberal in this respect (Matz, 1980).
Marriage restrictions were removed in the territory of the Federation
of Northern Germany (Norddeutscher Bund) with the federal treaty (Bundesordnung)
of 1867 and for the whole of Germany in 1871. After that it was no longer
necessary to have a certain income in order to marry. Marriage restrictions
were also found in some other continental countries such as Switzerland.
In general, the legal barriers to marriage were removed only in the last
third of the nineteenth century. In all German states and in many European
countries, there was a slight increase in the marriage rate in the 1870s.
After the legal barriers to marriage had been removed, social and economic
barriers increasingly came to the forefront. Economic and social developments,
such as the spread of female employment, the increase in educational participation,
the growth of employment in the public sector, and longer time spent in
education, were new checks on the freedom to marry. These factors could
be significant for the stagnating or declining nuptiality in Western Europe
up to 1914.
The general trend in all European countries over the last 150 years is
thus the universalization of the right to marry for all population groups
and a declining interest of the state in marriage law. The law still regulates
the age at marriage and the sex of the marriage partners and bars incestuous
and polygamous marriages (Glendon, 1989: 38ff.). In a longterm perspective,
the importance of bourgeois marriage as a model of familial behaviour
increased after 1850. Thus, the general tendency can be called universalization
of marriage regardless of social status and income position.
Since the 1960s a trend in the opposite direction has appeared, in family
sociology called the 'deinstitutionalization of marriage and family' (Kaufmann,
1990; see also Meyer, 1993). Based on the sociological tradition of institutional
analysis, it is claimed that the 'bourgeois' (or middle-class) family
as a highly institutionalized model was valid until the 1960s, and that
since then a reversal of this model has occurred. Institutionalization
of marriage as a longterm process should therefore mean the societal acceptance
of the model of the 'bourgeois' family, understood as the Parsonian normal
family consisting of parents and two children.
Figure 2: Fertility and Legitimacy, Denmark
1867-1940
This problem can be dealt with under different aspects: first, the legal
aspect of family and marriage law which create explicit norms. One may
ask whether in this domain there are important processes of institutionalization
and subsequently processes of deinstitutionalization. Second, the question
concerning social structural changes has to be raised, exerting possible
effects on these processes. Third, a society cannot be seen as a homogeneous
block, but must be analysed as a stratified system with classspecific
family and related social behaviour.
Marriage and Legitimacy
According to Goody (1983), in a longterm perspective the conjugal family as it exists today-with the monopoly on reproduction-is a product of Christianity, fighting for centuries against non-marital and extra-marital relationships and thus creating the problem of illegitimacy (Figure 2). A perspective orientated much more in economic history argues that illegitimacy is heavily bound to the respective mode of production. Thus, surprisingly, one of the highest proportions of illegitimacy in history was found in Catholic countries (Bavaria, Austria). The influence of the Church as monocausal factor is therefore not a sufficient explanation. In agricultural societies the extent of illegitimacy was, among other things, also dependent on the regulations of agriculture. Illegitimacy was fairly high in regions with single farms and inheritance by the principal heir; the structure of the agrarian economy in latifundia or family economies may also have played a role. Other factors, especially since the nineteenth century, are liberalization and the growth of lower strata in the process of industrialization. Another chain of argumentation could be that the extent of illegitimacy mainly depends on other demographic factors. Thus, the lower the age at marriage and/or the proportion of persons married, the lower the share of illegitimate births. Another important factor is probably the legal status of the illegitimate child, which differed greatly from country to country. In some German regions with inheritance law of the principle heir and in Austria, premarital, non-marital and extra-marital children were highly welcome as labourers and proof of fertility, explaining the very high rates in these regions
(Mitterauer and Sieder, 1982; Mitterauer, 1983).
Growth of Divorces and Liberalization of Divorce Law
The dissolution of marriage was not possible until the beginning of the nineteenth century, when it was only possible in some cases, if at all (Figure 3). The grounds for divorce were very limited. Between 1920 and 1965 there were no fundamental changes in divorce legislation, in contrast to the development in divorce rates. Exceptions can be seen in a longer list of grounds for divorce in England (1937) and the divorce legislation of the National Socialists in Germany and Austria (1938). Northern European divorce law is characterized by its flexibility. In Scandinavia there is a wide range of grounds for divorce and it is possible to get a divorce after a certain phase of marital separation, indicating the existence of the principle of breakdown of a marriage and divorce by mutual consent. In the United Kingdom flexibility is provided by the common-law system, based on case law and the principle of legal precedent, which gives the judge greater autonomy in deciding. In other parts of Europe divorce law is bound much more by legal regulation. The countries with law based on the Napoleonic Code-France, Belgium, Luxemburg, and The Netherlands-can be distinguished from Germany and Austria, with the German law tradition based on the civil code (Bürgerliches Gesetzbuch (BGB)); the BGB also exerts its influence on Swiss divorce legislation. The Code Napoléon was in principle valid until the 1970s. Divorce legislation based on the BGB was not as liberal as that based on the Code Napoléon. The BGB allowed for divorce only in case of violation of marital duties, and divorce by mutual consent was accepted only in a few cases.
Figure 3: Marriages and Divorces, Denmark 1850-1939
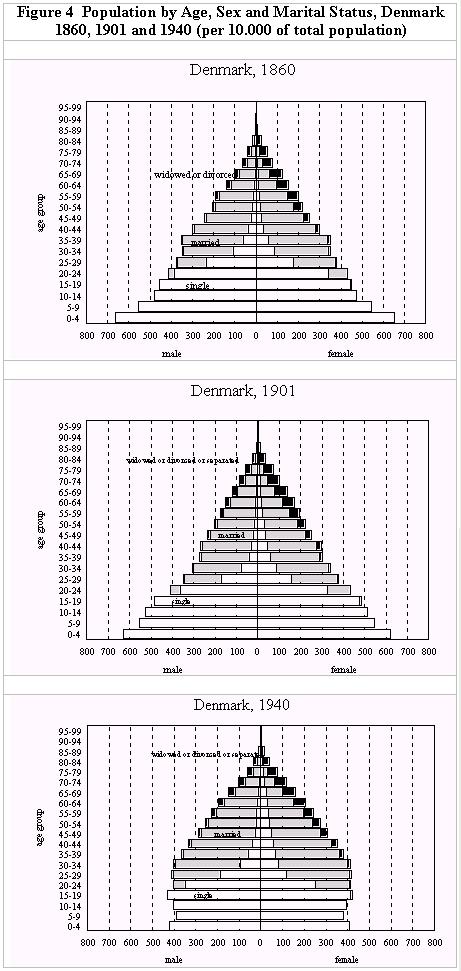
Population Ageing
Using Figure 4, some trends in age and sex structure, fertility, nuptiality,
celibacy and life expectancy are discussed, taking Denmark as an example.
The direction of the tendendies revealed by the Danish case is similar
for most European countries, although level and speed of differ by country.
Figure 4 reveals interesting developments in the age structure of the
Danish population combined with sex and the marital status over 80 years,
covering the period from 1860-1940. In 1860 the age pyramid still shows
the pretransitional pattern of a population with nonexistent birth control.
The age structure is concave with very large proportions of the age group
0-4 and 5-9. The cohorts of young adults in their twenties were comparatively
small when compared with the age groups of the 35-39 year olds. Possibly
during the 1820s there was an increase in the birth rate after the end
of the Napoleonic wars and the hunger crisis of 1816. A very large proportion
remained unmarried for a long time in their lives and age at marriage
was rather high. People only started to marry during their twenties and
thirties. In 1860 men married later than women. In the higher age groups,
widowhood became an essential social status for women. There were much
fewer widowed men due to lower life expectancy and therefore smaller cohorts
and therefore higher chances to remarry when a man became a widower.
During the fourty years from 1860 until 1901 this structure changed only
little. Nevertheless, first signs of the starting fertility decline can
be detected. The concave pattern of the age pyramid became more linear,
i.e. the youngest age groups (0-4 and 5-9) declined in size due to the
spread of birth control. Age at marriage was lowered and the proportions
of nevermarried persons had declined. The effect of both was an increased
proportion of the population married.
During the next fourty years, until 1940, the picture changed dramatically.
The age pyramid now took on to a convex shape: the birth decline since
around 1900 reduced the proportion of people under 20 years of age considerably.
The cohorts of the 0-4 year olds was as large as the one of the 15-19
year olds. Age at marriage had declined further and the proportion of
people married had increased. In addition, there was already a slighty
improvement in life expectancy for persons of very high age, e.g. for
persons over 80 years old. Far more women than men now remained single
for a longer time. The proportions of women never married were now higher
than in 1901.
Figure 4: Population by Age, Sex and Marital Status, Denmark 1860, 1901 and 1940 (per 10.000 of total population)
References
Catalan, J. (1995), The Development of Two European Peripheral Economies
in the Long Term: Poland and Spain, 1450-1990. MZES, Working Paper, AB
III/No. 13. Mannheim: Mannheim Centre for European Social Research.
Glendon, M. A. (1989), The Transformation of Family Law. State, Law, and
Family in the United States and Western Europe. Chicago and London: The
University of Chicago Press.
Goody, J. (1983), The Development of the Family and Marriage in Europe.
Cambridge: Cambridge University Press.
Hajnal, J. (1965), 'European Marriage Patterns in Perspective'. In D.V.
Glass and D.E.C. Eversley, eds. Population in History. Essays in Historical
Demography. London, 101-43.
Kaufmann, F.-X. (1990), 'Familie und Modernität'. In K. Lüscher,
F. Schultheis and M. Wehrspaun, eds. Die 'postmoderne' Familie. Familiale
Strategien und Familienpolitik in einer Übergangszeit. Konstanz:
Universitätsverlag, 391-415.
Matz, K.-J. (1980), Pauperismus und Bevölkerung: Die gesetzlichen
Ehebeschränkungen in den süddeutschen Staaten während des
19. Jahrhunderts. Industrielle Welt, vol. 31. Stuttgart: Klett.
Meyer, T. (1993), 'Der Monopolverlust der Familie: Vom Teilsystem Familie
zum Teilsystem privater Lebensformen'. Kölner Zeitschrift für
Soziologie und Sozialpsychologie 45: 23-40.
Mitterauer, M. (1983), Ledige Mütter: Zur Geschichte illegitimer
Geburten in Europa. München: Beck.
-- and R. Sieder (1982), The European Family. Patriarchy to Partnership
from the Middle Ages to the Present. Chicago: The University of Chicago
Press; Oxford: Blackwell.
Pounds, N.J.G. (1979), An Historical Geography of Europe, 1500-1840. Cambridge:
Cambridge University Press.
Rothenbacher, F. (1997), Historische Haushalts- und Familienstatistik
von Deutschland 1815-1990. Frankfurt/New York: Campus Verlag.
-- (1998), 'Social Change in Europe and its Impact on Family Structures'.
In J. Eekelaar and T. Nhlapo, eds. The Changing Family: International
Perspectives on the Family and Family Law. Oxford, UK: Hart Publishing,
3-31.
Schofield, R., D. Reher, and A. Bideau, eds. (1991), The Decline of Mortality
in Europe. Oxford: Clarendon Press.
Publication of Handbook
The data handbook will be published at Macmillan Press in the Series 'Societies of Europe': Rothenbacher, Franz and Peter Flora: The European Population, 1850-1945. London: Macmillan Press (forthcoming).