| |
|||
Content |
|||
 Newsletter
issues Newsletter
issues |
|||
| Combined
index |
|||
| Imprint |
|||
| Contact
|
|||
United Kingdom
by Franz Rothenbacher
The United Kingdom of Great Britain and Northern Ireland is situated north-west of the European continent between the Atlantic Ocean and the North Sea. It consists of one large island and several smaller islands, forming Great Britain, and the six northern counties of the island of Ireland. The total surface covered is 242,910 sq km with 58,801 million inhabitants (1996). The UK is therefore one of the most densely populated countries of Europe, with the southern parts of the country reaching the highest density figures of Europe as a whole. Until today, the geographical and geopolitical position of the country have influenced the economic, social and political orientation of the country. The isolated position of the country made it difficult for influences coming from the European continent to diffuse.
State Formation and History
The United Kingdom is composed of Great Britain and Northern Ireland.
Great Britain itself consists of three different parts: England, Wales,
and Scotland. The United Kingdom of Great Britain and Ireland was originally
established in 1801, when Ireland formally became part of the country.
(As Ireland is treated in a separate chapter, we only deal with Great
Britain and Northern Ireland here. Concerning Ireland and the Irish Republic
see also the chapter on Ireland). The United Kingdom therefore consists
of four parts: England, Wales, Scotland, and Ireland (since 1921 Northern
Ireland).
Attempts to unify the British Isles under one crown date back to the high
Middle Ages. The country's centre of power has always been situated in
the south at the river Thames, close to the merchant cities of the continent
(Belgium, The Netherlands) and the mouth of the river Rhine. Therefore,
the conquest of the country came from the Anglo-Saxon world. As early
as 1277 Wales lost its independence and was formally dissolved by the
Tudor family. Scotland remained formally independent until 1707, when
a union between England and Scotland was concluded. However, insurgency
persisted, and the last battle between the English and Scottish was fought
as late as 1746 (Culloden). Ireland was integrated into the United Kingdom
in 1801. In 1921 Southern Ireland gained independence, while Northern
Ireland remained part of the United Kingdom.
All four parts of the kingdom have kept some sort of home rule, although
the UK is not a federal state. But the administration of the four parts
of the country differs due to tradition, history, and local conditions.
This is also apparent with regard to statistics (general literature includes
Kamerman and Kahn, 1997; Ringen, 1997; Laslett and Wall, 1972; Teitelbaum,
1984; Coleman and Salt, 1992; Joshi, 1989; Wall, Robin, and Laslett, 1983;
Wrigley and Schofield, 1981).
The Political System
The United Kingdom is a constitutional monarchy, although without a
written and codified constitutional law, with the Parliament as legislator
and the Government-the Cabinet and other ministers, and the administrative
system-as executive. The judiciary is independent and determines common
law and interprets statutes. Head of state and national symbol of identification
is the monarch; monarchy is hereditary.
The parliamentary system developed very early and culminated in the republic
(1649 to 1660). Absolutist rule gained ground again during the 18th century,
but full representation of the population was not achieved before the
early 20th century.
During the 1990s the decentralization of the country gained momentum:
the historically differing parts of the UK, Wales and Scotland on the
one hand and Northern Ireland on the other, requested more and more political
autonomy. After long debates, the Scottish Parliament and the National
Assembly for Wales were finally constituted in 1999. The Northern Ireland
Assembly will function fully once final elements of a cross-community
agreement are implemented.
The system of public administration deviates strongly from the continental
French model: there is a very small nucleus of civil servants, while most
of the administration consists of public employees.
In the realm of public administration far-reaching reforms have been introduced
since the 1980s. The civil service has been restructured and reduced in
personnel by over 30%, some public services have been privatized, many
others transformed into Executive Agencies with greater operative autonomy.
The philosophy is to introduce private company management into the public
services, especially in order to increase performance, efficiency and
effectiveness, among others.
Population Structure
As early as the nineteenth century the UK was one of the most densely
populated countries in Europe. In 1871 there were 121 inhabitants per
square kilometre, and by 1931 population density had reached the level
of 197 inhabitants per square km. The population is very unequally distributed
over the four parts of the UK: England more or less constantly makes up
three-fourths of the total population, Wales around 5%, Scotland roughly
10%, and Northern Ireland (since 1921) less than 3%. The unequal distribution
of the population over the territory is reflected in the uneven population
density. The population density in England has always been higher than
in other parts of the country. Wales ranked second, Northern Ireland third,
and Scotland last. This pattern remained stable in the one hundred years
from 1850 to 1950. The population density of England and Wales increased
faster and far more strongly than that of Northern Ireland and Scotland.
Obviously, strong internal migration is one characteristic of this period.
Regions with major population agglomerations in England are the counties
of York West Riding, Lancaster, and Greater London. These three counties
account for over 35% of the population of England, and their population
density is the highest in England: Greater London has had a population
density of over 10,000 since 1891, the county of York city had a population
density of over 5,000 inhabitants in 1931, and the county of Lancaster
had a population density of over 1,000 inhabitants in 1931.
Wales had a very uneven population structure. As early as 1871 33% of
the population lived in the county of Glamorgan, a figure that rose to
47% in 1931. The county of Monmouth ranked second, accounting for 17%
of the total population in 1931. Altogether, these two counties alone
accounted for two-thirds of the Welsh population in 1931 and, as a consequence,
had the highest population density. Glamorgan had 580 inhabitants per
sq km in 1931, and Monmouth 310.
In Scotland the city of Glasgow accounted for one-fifth of the total Scottish
population as early as the nineteenth century. Urbanization had increased
this proportion to 33% by 1931. Second in population size came the county
of Edinburgh (Midlothian) with a rate of approximately 11% in 1931. Of
course, both counties also had the highest population density. The large
regional differences regarding the population density and their remarkable
stability over time are characteristic for Scotland.
Northern Ireland, finally, shows a highly urbanized pattern. In the inter-war
period Belfast already accounted for one-third of the population of Northern
Ireland. Over two-thirds of the population lived in only three counties-Belfast
C.B., County Down, and County Antrim-in 1937.
Natural population growth in the UK during the second half of the nineteenth
century was constantly high with values well over 10 per 1,000. Natural
population growth from the 1860s until World War I was remarkably stable
and did not have any major fluctuations due to economic crises or military
conflicts. During the second half of the nineteenth century there was
a constant flow of emigration from the British Isles. The net migration
rate was always negative, fluctuating between 2 and 5 per 1,000. Only
the 1880s were a period of stronger emigration.
World War I changed this rather stable and continuous development. The
natural population growth rate declined in the last war years, reaching
its lowest level in 1918 with only 1.8 per 1,000. After the war, from
1920-1, the natural population growth reached pre-war levels, but after
that time during the whole inter-war period natural population growth
was substantially lower than before World War I. The declining population
surplus caused emigration to cease. While during the 1920s emigration
was still higher than immigration, the pattern was reversed during the
1930s. In the 1930s Britain changed from a traditional country of emigration
to a country of immigration. The low birth rates of the 1930s therefore
could partly be compensated by immigration. Nevertheless, the total population
growth rate during the inter-war period was only half of what it had been
in the second half of the nineteenth century.
Table: Statistical comparisons
Economy and Material Living Conditions
Although the UK had a head start regarding the industrial revolution,
the economic lead deteriorated during the 20th century. The result of
the economic development after 1945 was prosperity until the 1960s, but
during the 1970s and 1980s the country was hit by economic recession.
The economic reforms during the era Thatcher led to a recovery of the
economy in the 80s and 90s.
Measured by GDP per capita, the UK, within the group of 25 OECD countries,
has a very stable position at rank 17, 18, or 19, i.e. within EU-15 the
UK is in the bottom 25%, but higher than the Mediterranean countries (Dilnot
and Emmerson, 2000).
Material living conditions are therefore on average only in a middle field
in Europe. This goes hand in hand with a high inequality in economic resources
like income. The overall trend in income inequality since 1900 was a strong
decline in income inequality: the bottom moved up while the top moved
down. The economic reforms since the 1970s resulted in another increase
in income inequality.
Demography and Family
The demographic transition of the UK is a somewhat artificial subject:
first, the country's borders changed with the independence of the Irish
Republic. Second, the country is composed of four parts that differ significantly
in various ways: territory, population size, population structure, etc.
Here we argue that England alone, which in 1951 accounted for 79% of the
total population of the UK, is large enough to be representative of the
UK as a whole.
Due to the great differences between the different countries of the UK,
we will at certain points refer to developments in individual parts, such
as England. During most of the demographic transition, the UK had a rather
high natural population growth. In the 1860s the birth rate was rather
high, and the death rate was very low and below the European average,
resulting in a strong natural population growth. During the second half
of the nineteenth century both the birth and the death rates showed no
major irregularities apart from increases in the death rate, probably
mainly due to epidemics. The first major distortion of the demographic
development during the transition phase came with World War I which caused
a massive postponement of births and a major increase in the death rate.
Although the period after the war experienced a rise in the birth rate,
its decline accelerated due to the economic depression in the late 1920s
and early 1930s. The 1930s, in particular, were a period experiencing
political, social, and economic instability with consequences for demographic
behaviour. During the 1930s the natural population increase dropped off
sharply. World War II made the birth rate decline further and the death
rate rise. Immediately after the war there was a jump in the birth rate,
probably a cohort effect, to some extent, from the post-World War I period.
The birth rate declined in the 1950s, whereas during the 1960s the 'second
demographic transition' began with a rise in fertility and a subsequent
decline. In the mid-1970s population growth became zero when the birth
rate converged with the death rate. Natural population growth in the 1980s
was very low, due to the low fertility level.
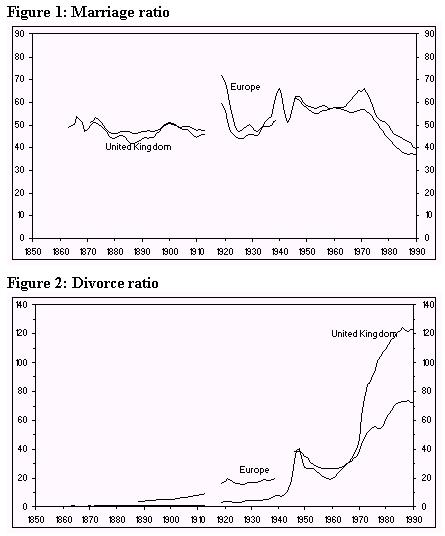
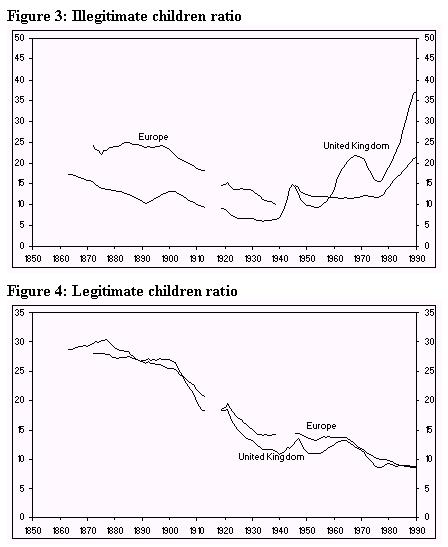
Figure 1: Marriage ratio
Figure 2: Divorce ratio
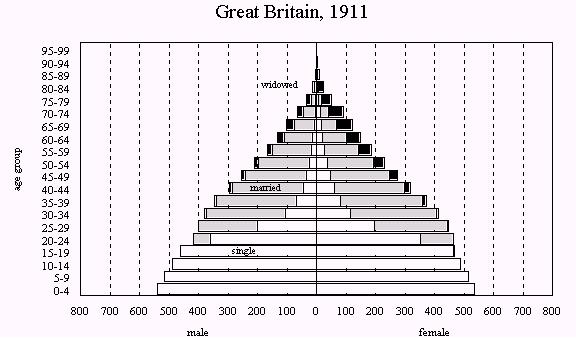
Figure 3: Illegitimate children ratio
Figure 4: Legitimate children ratio
When the demographic transition of the UK is compared with the European average, it becomes apparent that as early as the nineteenth century the UK birth and death rates were lower than the European average. But in the UK the death rate was so low-thanks to low infant mortality-that the natural population increase was high. The consequences of two world wars in the twentieth century, however, brought an end to these high growth rates. In particular, the crisis in the inter-war period brought British fertility below the European level. The post-World War II demographic development, too, was shaped by lower natural population growth than the European average. Thus, the British Isles experienced high population growth earlier than most European countries -that is, as early as the eighteenth century-due to an early decline in mortality. This pattern survived until the end of the nineteenth century. The consequence of the early population growth-especially in England-was a high population density already in the first half of the nineteenth century.
Family Life
Although the rate of female celibacy was high in the UK during the nineteenth century as well as the age at marriage, the rate of illegitimate fertility was low, much lower than the European average. The illegitimate fertility rate showed a declining trend during the 100 years from 1850 to 1950, with a temporary increase in the 1890s. The decline in illegitimate births began earlier than that of legitimate births. World War II caused a fundamental change in the illegitimacy pattern in the United Kingdom. During and after the war the illegitimate fertility rate rose, but declined during the 1950s with the marriage boom. In the 1960s another change occurred when illegitimate fertility in the UK exceeded the European rate for the first time. A fundamental change in fertility values must have occurred during that time. In the 1970s there was a wave of illegitimacy with a subsequent decline in the 1980s. After that illegitimate fertility increased strongly and now shows a pattern similar to the Nordic countries.
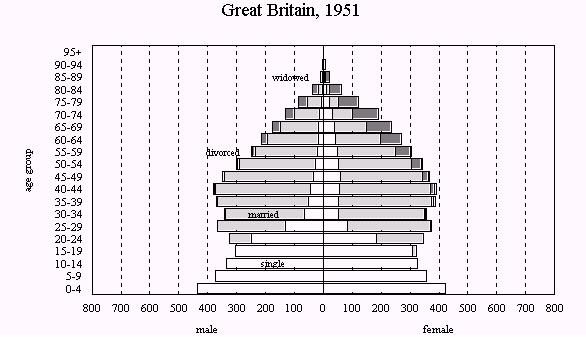
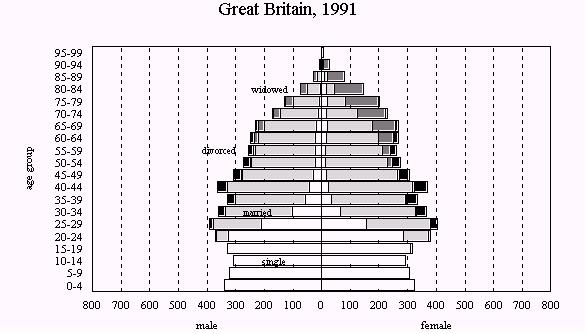
Great Britain: 1911
Great Britain: 1931
Great Britain: 1951
Great Britain: 1991
More or less the opposite can be said of the development of legitimate
fertility. It was higher than in Europe during the nineteenth century
but lower after World War I. However, the development of legitimate fertility
follows the European pattern rather closely. The birth decline mainly
affected legitimate fertility, which declined strongly during the demographic
transition, while illegitimate fertility declined far less.
During the last 150 years the UK has thus undergone a fundamental change
from low illegitimacy to high illegitimate fertility. This change in demographic
behaviour is the result of fundamental changes regarding the concepts
of marriage and childbirth. After World War II, childbirth before and
without marriage became a socially accepted fact.
The UK belongs to the country group with the Western European marriage
pattern of late and non-universal marriage. Nevertheless, it must be emphasized
that the pattern was not as pronounced as in countries such as Switzerland,
Austria, and later Finland.
The following discussion is mainly based on data from England and Wales.
Calculations for the UK have not been made for the indicators on the proportion
married at age 20-24. From the 1850s to the 1870s the proportion of women
married at age 20-24 was rather high, at over 30%, a figure which puts
England closer to countries like France and Italy than to the Nordic countries,
where this proportion was only 20%. This means that in England, the age
at marriage was already low in the mid-nineteenth century. Although the
proportion of women married at age 20-24 declined after 1870 and remained
on a lower level until the 1930s, the national level was still higher
than in the Nordic countries. In other words, the age at marriage increased
and was especially high during the inter-war period. Starting in the 1930s
the age at marriage started to fall, and the proportion of women married
at age 20-24 increased, peaking at around 1970 with nearly 60% of women
married in their early 20s. This proportion is the highest ever in all
Western European countries. In England, the postponement of marriage after
this wave of early marriage started later than in the Nordic countries.
Thus, structural traits in English society favoured early marriage in
the nineteenth century and continue to do so today.
The pattern for English men is similar to that for English women, with
the main difference being that the marriage pattern of English men deviated
even more strongly from that of men in other European countries. In the
1870s, 20% of English men were married at the early age of 20-24 years.
In most Nordic countries this proportion was only about 10%, and even
in Southern European countries the proportion was smaller. The tendency
of English men to marry early is exceptional in European demographic history.
As for English women, the age at marriage increased after the 1870s and
reached its highest level in the 1930s; but even at this time English
men married earlier than men in most other Western European countries.
Since the early 1930s English men increasingly favoured early marriage,
and in 1970 the proportion of men married at age 20-24 peaked at 38%.
Along with the Belgians, English men married earliest of all Europeans.
As it did for English women, the subsequent postponement of marriage started
later for English men as well. They retained their pattern of early marriage
much longer than other male Europeans.
Marriage intensity can be measured by the marriage rate and the celibacy
rate. 'Intensity' means the availability of marriage, but at the same
time the urgent need to remarry after widowhood. The high celibacy rate
of English women in the mid-nineteenth century clearly places England
within the country group with the Western European marriage pattern. But
there are important differences when compared with the demographically
most similar countries, the Nordic countries. In the 1870-90s roughly
30% of English women were never married at age 45-54, a proportion very
similar to countries such as Sweden, Norway, and Finland. But what distinguishes
England from the Nordic countries is the early decline in the celibacy
rate at a time when it was still increasing in those countries. In England,
there was a slight decline in the celibacy rate after 1900, which continued
until World War II and accelerated strongly after the war. As in other
countries the trend towards universal marriage was mainly carried by female
birth cohorts born after World War I. The celibacy rate of women reached
its lowest level at approximately 5% in the 1980s; that is, in the 1980s
95% of English women had married at least once at age 45-54. In the 1990s
a trend towards increasing celibacy started, carried by the birth cohorts
born after World War II.
For the marriage rate we again have data for the United Kingdom, but there
are basically no structural differences between UK figures and figures
for England and Wales. The basic features are the same, given the impact
of the population share of England and Wales in the whole UK, which was
83% in 1931. During the nineteenth century the marriage rate was slightly
below the European average. Only in the late 1930s did this pattern change:
the rate rose above the European average and remained at this level in
the second half of the twentieth century, too. As early as the nineteenth
century the UK was influenced by the Western European pattern of late
and non-universal marriage. The country changed its position during the
twentieth century. When compared with the Nordic countries, where marriage
had a low standing in society (as revealed by demographic indicators),
people in the UK married earlier, more frequently, and a larger proportion
of the population married. It is often asked whether this feature can
be attributed mainly to a high degree of industrialization and urbanization
in the United Kingdom versus the predominance of peasant societies in
the Nordic countries.
Marital stability, when measured by the divorce rate, was very high during
the nineteenth century and fell only slightly during the first half of
the twentieth century. A first major upswing in the divorce rate came
as a consequence of World War II, when many marriages broke down. The
divorce rate peaked in 1945-50. Divorces declined during the 1950s, when
the marriage boom set in. In the 1960s the divorce rate started its secular
increase, first obviously due to structural causes; in the late 1960s,
however, a major liberalization of the divorce law was enacted. The consequence
was a tremendous increase in divorces, and the divorce rate now exceeds
the European divorce rate for the first time since the nineteenth century.
The low divorce rate in the United Kingdom until the post-war years is
mainly explained by the restrictive divorce law. In England and Wales
divorce was only introduced in 1859; before that only legal separation
existed and, to a limited extent, divorce by a private Act of Parliament.
The act of 1859 introduced civil marriage and divorce on grounds of fault.
In 1923, men and women obtained equal status in divorce law, and in 1937
the grounds were extended considerably. Finally, in 1971 divorce on the
sole condition of marital breakdown was introduced. In Northern Ireland
divorce on grounds of fault was introduced as late as 1937 in accordance
with the English law of 1937.
Social Security
Specific to the UK is the late development of national social security
institutions. Poor law was effective until the turn of the 20th century
(Old Age Pensions Act of 1908). Before World War I only basic and very
low pensions were provided. Social security was, in principle, based on
the liberal philosophy of self-help, with supplementary care for the poor.
The studies on poverty conducted by Webb and Rowntree made clear that
poverty was a wide-spread social fact. The fundamental restructuring and
reforming of the British social security came with the Beveridge report
of 1942. After World War II, a national and universal system of social
security was introduced in gradual steps (incrementally). A National Health
Servive (NHS) was established in 1948, which offered medical services
and treatment without direct payment. Concerning old age security, a contributory
and flat rate pension was introduced after the war. In 1961 a second-tier
earnings-related pension was introduced and-because of malfunctioning-replaced
by the more extensive State Earnings Related Pension Scheme (SERPS) in
1975. The supplementing of SERPS with a second public earnings-related
pension is under discussion. The reasons are to be found in the deterioration
of the basic pension and the low level of pension benefits and replacement
rates in general. Family allowances were introducd in 1945 with the Family
Allowances Act.
The system of social security today is a universal system of social benefits
with several exceptions. In the realm of pensions, the majority of the
work force is contracted out of SERPS; instead, they are covered by occupational
pension systems, because the benefits these provide are often better than
those provided by SERPS. This is especially true for public employees.
The possibility to contract personal pension plans with private insurance
agencies adds another element of differentiation to the height of pensions
and therefore to life chances in old age.
Education
Concerning the educational system of the UK, a threefold structure can
be identified: the primary, secondary and tertiary educational level.
The primary and secondary educational level have several characteristics
which distinguish them from continental countries: a rather large sector
of private schooling, early start of schooling (at age 4-5), and a school
system rooted in local government. Furthermore, there are more superficial
phenomena (epiphenomena) such as school uniforms and a rather rigid school
discipline. School attendance rates have been traditionally low in the
UK, despite it being a protestant country. (According to Max Weber's protestantism
thesis, protestantism would further school attendance). It was only after
World War II and especially in the last few decades that school attendance
increased; now we can speak of mass participation in secondary schools.
Class-differences are still rather pronounced in the UK school system,
an observation which is in line with the general picture of rather large
class differences in the UK when compared with continental European countries
(e.g. income inequality).
Tertiary education has for a long time been restricte to a small proportion
of the population in the UK: only a small minority attended universities.
The two most prestigious universities of Cambridge and Oxford have nevertheless
not been the only ones: other universities, like the University of York
and London, have existed since the middle ages. But tertiary educational
expansion in the UK came relatively late in the 20th century, that is
not before the 1990s, when a system of tertiary mass education was introduced.
Nevertheless, a polarized university structure with some few elitist universities
(Oxbridge, Eton) along with universities for the "masses" has
survived until today.
Despite this tendency towards mass university education, tertiary educational
attendance rates in the UK have comparatively low levels, together with
Germany, Austria and Switzerland (Halsey, 2000).
Social Data Production
National data production: Office for National Statistics (ONS), founded
in 1996 by merging the Central Statistical Office (CSO) and the Office
of Population Censuses and Surveys (OPCS).
Functionally decentralized statistical system: ministries still publish
many ressort statistics.
Territorially decentralized statistical system: Wales, Scotland and Northern
Ireland collect their own statistics.
The CSO was one of the leading statistical offices in the field of social
reporting and has published since 1970 the "Social Trends".
In the last few years this annual report has been supplemented by the
"Social Focus on ..." series with reports on such specific population
groups as children, ethnic minorities, women, families, and the unemployed.
It is also inteded to publish Social Trends Quarterly (see EURODATA Newsletter
no. 9, Spring 1999, p. 24f.).
Concerning data collection and analysis by the social sciences, the most
important organization for the collection and storage of social science
data was the Economic and Social Research Centre (ESRC) at Essex, during
the 1990s transformed into the Institute for Social and Economic Research
(ISER). ISER incorporates the ESRC Research Centre on Micro-Social Change
- more widely known as the British Household Panel Study (BHPS) - established
in 1989, the ESRC UK Longitudinal Studies Centre - founded in 1999, and
the European Centre for Analysis in the Social Sciences (ECASS).
Further Reading
Beveridge, W. (1942), Social Insurance and Allied Services. London:
His Majesty's Stationary Office.
Butler, D., and G. Butler (2000), Twentieth-Century British Political
Facts 1900-2000. 8th ed. Houndmills, Basingstoke, Hampshire: Macmillan
Press.
Coleman, D., and J. Salt (1992), The British Population: Patterns, Trends
and Processes. Oxford: Oxford University Press.
Halsey, A. H. (2000), 'Further and Higher Education'. In Halsey and Webb,
eds., 221-53.
Halsey, A. H., and J. Webb, eds. (2000), Twentieth-Century British Social
Trends. Houndmills, Basing-stoke, Hampshire, and London: Macmillan Press.
Johnson, P., ed. (1994), Twentieth-Century Britain: Economic, Social and
Cultural Change. Longman: London and New York.
Joshi, H., ed. (1989), The Changing Population of Britain. Oxford: Basil
Blackwell.
Laslett, P., and R. Wall, eds. (1972), Household and Family in Past Time:
Comparative Studies in the Size and Structure of the Domestic Group over
the Last Three Centuries. Cambridge: Cambridge University Press.
Office for National Statistics (1999), Britain 2000: The Official Yearbook
of the United Kingdom. London: The Stationery Office.
-- (2000), Social Inequalities. 2000 edition. London: The Stationery Office.
Ringen, S., ed. (1997), 'Great Britain'. In S. Kamerman, and A. Kahn,
eds., Family Change and Family Policies in Great Britain, Canada, New
Zealand, and the United States. Family Change and Family Policies in the
West, vol. 1. Oxford: Clarendon Press, 29-102.
Speck, W. (1993), A Concise History of Britain 1707-1795. Cambridge: Cambridge
University Press.
Teitelbaum, M. (1984), The British Fertility Decline. Princeton, New Jersey:
Princeton University Press.
Wall, R., J. Robin, and P. Laslett, eds. (1983), Family Forms in Historic
Europe. Cambridge: Cambridge University Press.
Wrigley, E., and R. Schofield (1981), The Population History of England
1541-1871: A Reconstruction. London: Arnold.
Dr. Franz Rothenbacher
University of Mannheim
MZES
D-68131 Mannheim
Phone: 0049(0)621-181-2831
Fax: 0049(0)621-181-2834
E-mail: Franz.Rothenbacher@mzes. uni-mannheim.de.
Franz Rothenbacher is sociologist at the MZES and managing editor of this
Newsletter.
National Statistical Institute:
Office for National Statistics (ONS), Drummond Gate office, 1 Drummond
Gate, LONDON SW1V 2QQ, General Enquiries: +44 (0) 20 7233 9233;
The Family Records Centre, 1 Myddleton Street, LONDON EC1R 1UW, General Enquiries: +44 (0) 20 8392 5300; Newport office, Cardiff Road, NEWPORT South Wales NP10 8XG, Switchboard: +44 (0) 1633 815696, Library Enquiries: +44 (0) 1633 812973;
Runcorn office, East Lane House, East Lane, RUNCORN Cheshire WA7 2DN. Switchboard: +44 (0) 8700 012345; Southport office, Smedley Hydro, Trafalgar Road, Birkdale SOUTHPORT PR8 2HH. Switchboard: +44 (0) 1704 569824;
Titchfield office, Segensworth Road, Titchfield FAREHAM PO15 5RR. Switchboard: +44 (0) 1329 842511. E-Mail: info@statistics.gov.uk. Internet: http://www.statistics.gov.uk/.
ONS, The Library, Government Offices, Cardif Road, Gwent NP9 1XG, United
Kingdom, Tel: +44 1633 812973. Statistical Publications are available
from The Stationery Office. London Office, 51 Nine Elms Lane, London SW8
5DR. Internet: http://www.the-stationery-office.co.uk/
or from the ONS library.
Social Science Research Institutions:
Social Policy Research Unit (SPRU), University of York. Heslington, York
YO10 5DD. Tel +44 (0)1904 433608; Fax +44 (0)1904 433618; Text/voice (0)1904
432626. E-mail: spru@york.ac.uk.
Internet: http://www.york.ac.uk/inst/spru/.
Family Policy Studies Centre (FPSC), 9 Tavistock Place, London, WC1H 9SN.
Tel 0171-388 5900; Fax 0171-388 5600; E-mail: fpsc@mailbox.ulcc.ac.uk.
Internet: http://www.fpsc.org.uk.
Institute for Social and Economic Research (ISER), University of Essex,
Wivenhoe Park, Colchester CO4 3SQ, United Kingdom. Tel: +44 (0) 1206 872957,
Fax: +44 (0) 1206 873151, E-mail: iser@essex.ac.uk;
Internet: http://www.iser.essex.ac.uk/.
British Library of Political & Economic Science (BLPES), London School
of Economics and Political Science (LSE), 25 Southampton Buildings, London
WC2A 1PH. Tel +44(0)20 79557229. Internet: http://www.blpes.lse.ac.uk/.
Social Science and Political Journals:
Population Trends, London: Office for National Statistics, published by
The Stationery Office, 1.1975-, quarterly, ISSN 0307-4463;
Population Studies: A Quarterly Journal of Demography. Population Investigation Committee, London School of Economics. London [et al.]: Committee. 1.1947/48(1948)-. ISSN 0032-4728;
Journal of Public Policy. Cambridge: Cambridge University Press. 1.1981-. ISSN 0143-814X;
Journal of Social Policy: The Journal of the Social Policy Association. Cambridge: Cambridge University Press. 1.1972-. ISSN 0047-2794;
The British Journal of Sociology (BJS). 1.1950-. ISSN 0007-1315; British
Journal of Political Science. London: Cambridge University Press. 1.1971-.
ISSN 0007-1234.